Data Visualization With Power BI
Free Power Bi Course with Certificate
Learn Data Visualization with Power BI from basics in this free online training. This free course is taught hands-on by experts. Our online course is designed to teach you how to create interactive visualizations. Start Now!
What you learn in Data Visualization With Power BI ?
About this Free Certificate Course
This free Power BI course with certificate is a free course aimed at unraveling the complexities of Business Intelligence (BI) and equipping you with the ability to craft impactful visualizations. This course provides a solid foundation, starting with a basic understanding of BI, the importance of Data Visualization, and an introduction to key tools. Delve into the core of Power BI, learning about its essential components, the architecture, and the powerful Data Analysis Expressions (DAX) for dynamic data manipulation.
This Power BI course offers practical learning through hands-on experience with the Power BI installation, navigating its interface, and mastering visual analytics. Whether you're new to data visualization or looking to enhance your skills, this Power BI free course is designed to give you a deep dive into creating meaningful visual data representations. Enroll in this free Power BI course and take a significant step towards mastering Power BI, complete with a certificate to showcase your newfound skills.
Join us on this insightful journey, and take the first step towards building a successful career in Data Science and Business Analytics. Start your learning journey now!
Course Outline
This module will help you understand what BI is and understands its features and phases.
This module explains Data Visualization in detail and discusses the three main components that create Data Visualization.
This module will walk you through various popular tools like Tableau, Excel, and Power BI that support Data Visualization.
This module will help you understand what Power BI is and how to proceed with it. You will also go through Power BI architecture.
This module helps you know various components like Power Query, Power View, Power BI QNA, Power Pivot, and Power Map of Power BI.
Our course instructor

Mr. Vishal Padghan
With this course, you get
Free lifetime access
Learn anytime, anywhere
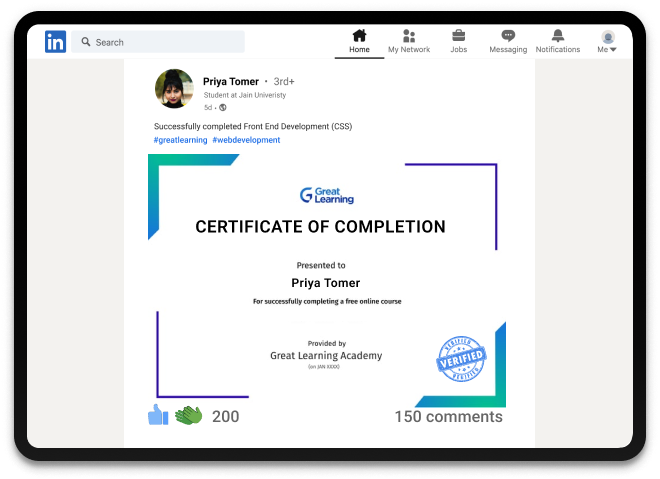
Completion Certificate
Stand out to your professional network
2.0 Hours
of self-paced video lectures
Frequently Asked Questions
What is Data Visualization in Power BI?
Data visualisation in Power BI involves developing graphical representations of data in the form of charts, graphs, and interactive graphics on the Power BI platform to deliver insights and improve understanding.
What is power bi and why is it used for data visualization?
Power BI is a Microsoft data visualization and business analytics tool that helps in converting data from various sources into interactive dashboards and reports.
How does power bi improve data analysis?
Power BI allows users to integrate data from multiple sources, transform data into a model, and create visually compelling and interactive reports.
Is power bi suitable for beginners in data visualization?
Yes, Power BI is designed to be user-friendly and is suitable for beginners. It offers a range of easy-to-use tools to create effective data visualizations without the need for advanced programming skills.
What are the key features of power bi?
Key features include data integration, custom visualizations, AI-powered insights, robust data modeling, and the ability to publish reports for shared access across organizations.
Success stories
Can Great Learning Academy courses help your career? Our learners tell us how.And thousands more such success stories..
Related Data Science Courses
Explore new and trending free online courses
Relevant Career Paths >
Other Data Science tutorials for you
Great Learning Academy - Free Online Certificate Courses
Great Learning Academy, an initiative taken by Great Learning to provide free online courses in various domains, enables professionals and students to learn the most in-demand skills to help them achieve career success.
Great Learning Academy offers free certificate courses with 1000+ hours of content across 1000+ courses in various domains such as Data Science, Machine Learning, Artificial Intelligence, IT & Software, Cloud Computing, Marketing & Finance, Big Data, and more. It has offered free online courses with certificates to 10 Million+ learners from 170+ countries. The Great Learning Academy platform allows you to achieve your career aspirations by working on real-world projects, learning in-demand skills, and gaining knowledge from the best free online courses with certificates. Apart from the free courses, it provides video content and live sessions with industry experts as well.


